Report
The Report page presents submission data as charts and visual summaries.
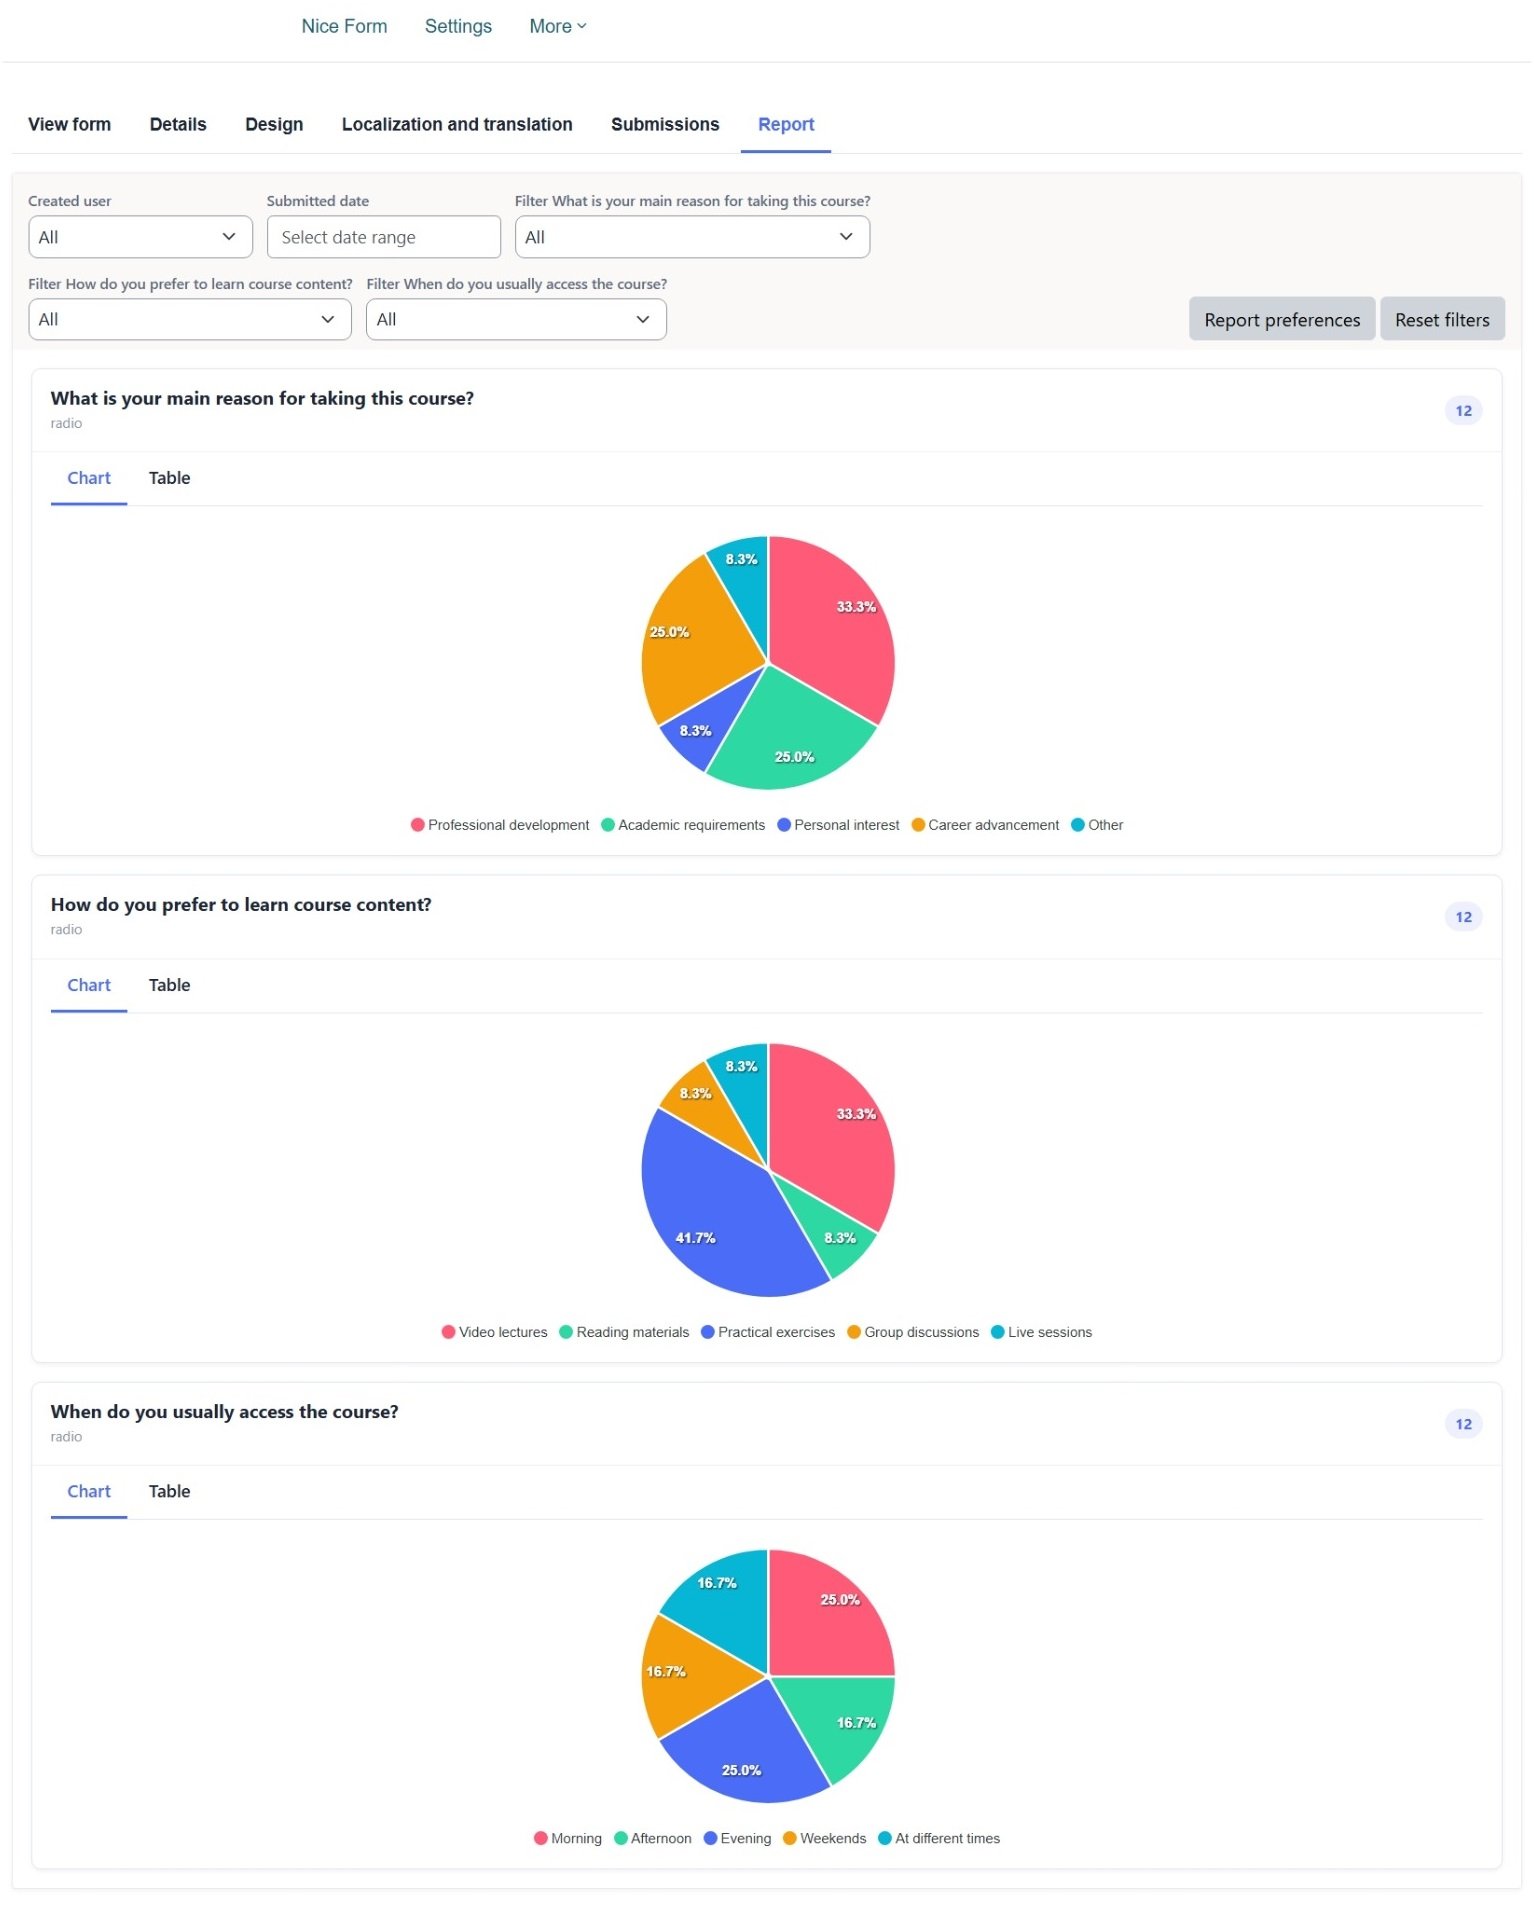
It allows users to examine response distributions without manually reviewing each individual submission.
Report Filters
The report page supports filters for fields such as:
- Select
- Multi-select
- Radio
- Checkbox
- Rating fields
- Submitted date
Submitted Date Range
Report data can be filtered using:
- From date
- To date
The charts are automatically refreshed to display submissions received during the selected period.
Report Preferences
The Report Preferences section allows users to customize the report.
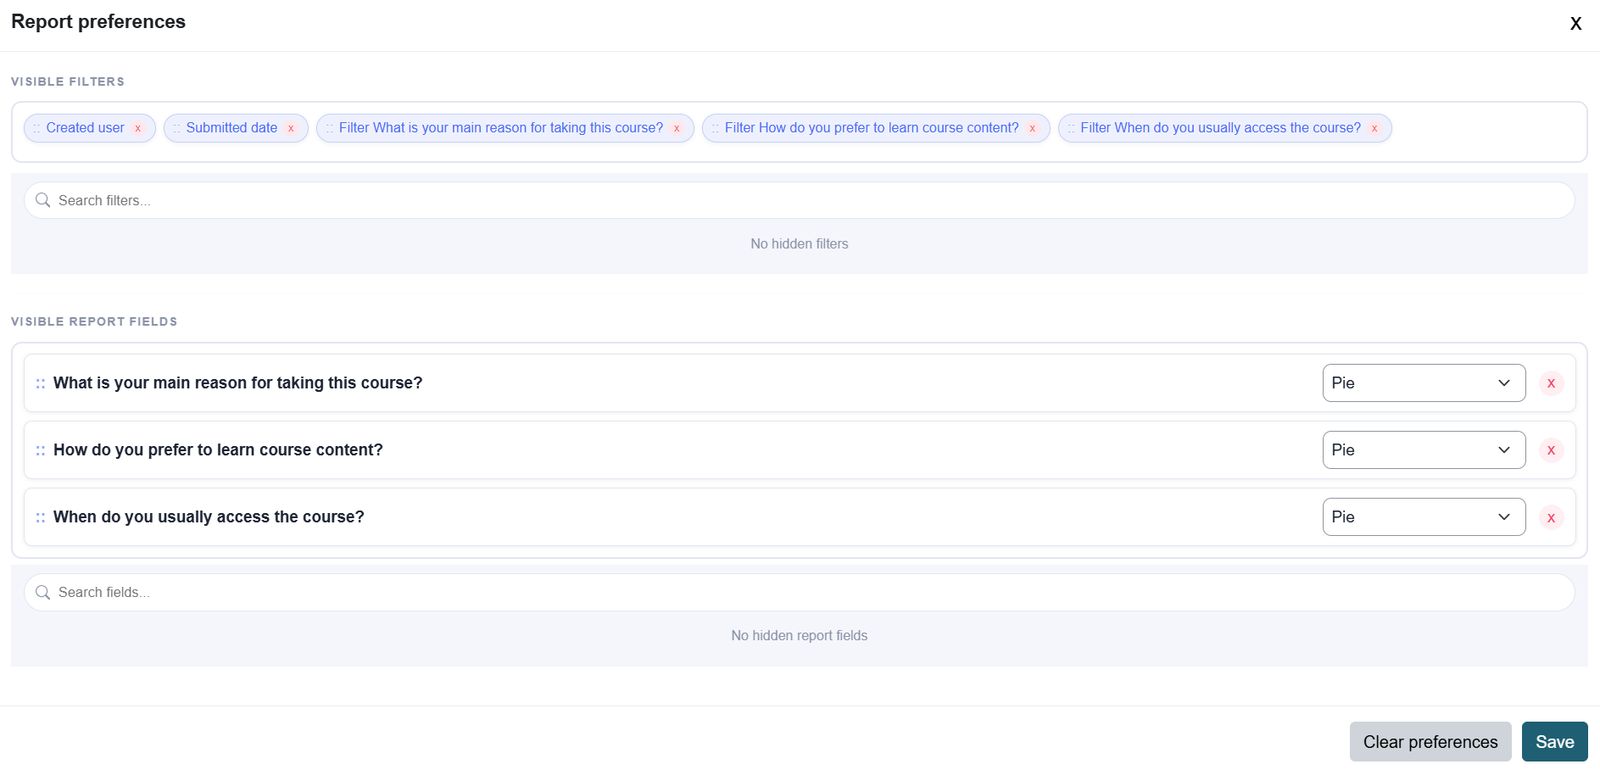
Visible Filters
Users can:
- Reorder report filters
- Hide unwanted filters
- Restore previously hidden filters
Visible Report Fields
Users can control which form fields are included in the report.
For each report field, users can:
- Reorder the chart
- Hide the chart
- Restore the chart
- Change the chart type
Available Chart Types
Depending on the field type, the following chart formats are available:
- Pie chart
- Bar chart
- Doughnut chart
Report preferences are saved separately for each user. This allows each user to create a personalized report view without changing the views of other users.
Was this page helpful?