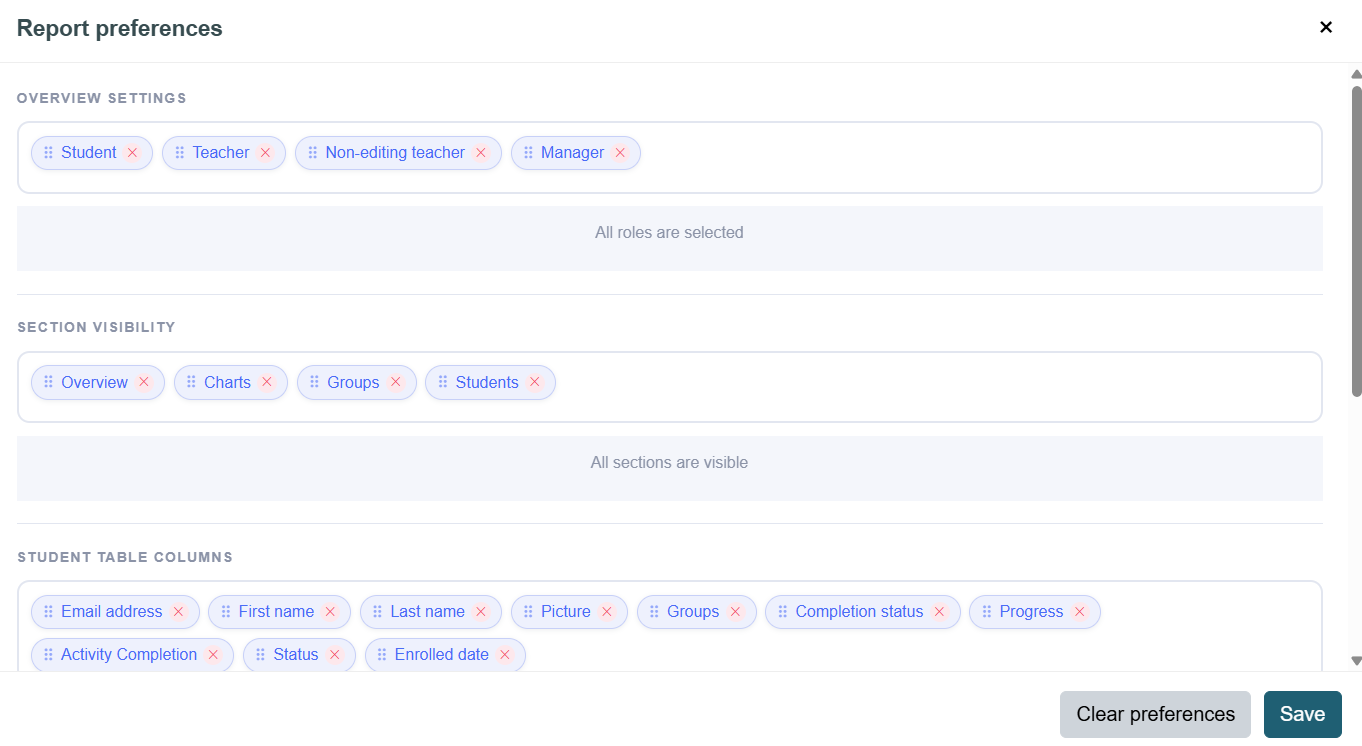
Report preferences
The Report Preferences allows users to customize the report page based on their needs. Users can choose what information to show or hide, adjust the order of selected items, and personalize the report layout.
This helps each user create a report view that is relevant to their role and reporting requirements.
Section Visibility
The Section Visibility setting allows users to show or hide full report sections.
For example, if a user does not need the Groups section, they can hide it from the report page. This helps keep the report focused and easier to review.
Sections that can be managed include:
- Overview
- Charts
- Groups
- Students
Overview Section Preferences
In the Overview section, users can choose which role cards should appear.
The available role cards include:
- Students
- Teachers
- Non-editing teachers
- Managers
Users can also change the order of the cards using drag and drop. This allows them to place the most important role summaries first.
Student Table Columns
The Student Table Columns setting allows users to choose which columns appear in the Students table.
Users can show or hide columns based on their needs. They can also adjust the order of the columns so the most important information appears first.
This is useful when users want to focus only on selected student details, such as name, email, group, completion status, progress, enrolled date, or custom fields.
Chart Settings
The Chart Settings option allows users to manage which chart fields appear in the Charts section.
Users can:
- Show or hide available chart fields
- Change the chart type
Supported chart types include:
- Bar chart
- Pie chart
- Donut chart
Purpose
Report Preferences give users flexibility and control over how the report appears. Instead of using one fixed layout, each user can customize the report to show only the sections, cards, columns, and charts that are most useful for their work.
Was this page helpful?